Seeing Through the Smoke
Bring Tech to the Wildfire Scene
What's the most memorable GIF you've seen?
For Jonathan Bowers - founder of Path and Focus - it was the playback of wildfire mapping screenshots he saw on X. The stagnant data from FireM3 had been pieced together into a 3 second GIF and spurred the idea, “We could make this better…”
“I started by putting the CSV files in Deck GL and shockingly, it worked! So I approached the team at TSR and posed the question…how could we make this even better…”
With experience developing everything from video games to avalanche forecasting software, the TSR team took on the project, determined to fill the gap in the industry.
The main priorities in developing Lens was:
- Accessibility to the General Public
- Accurate Information from Credible Sources
- Rapid Data (for a Rapid Problem)
While there's an abundance of public wildfire data available, it's often trapped in cumbersome systems that makes it frustrating and difficult to access.
Nature will never be tamed, but certain sources (like M3 Hotspots or FIRMS) provide a more accurate read on fire behaviours allowing for positive predictions.
Wildfires move fast - and the data needed to do the same. Unfortunately, speed usually comes with a price.

TSR would need to cloud-optimize the data and design a geospatial mapping for wildfires. Once the data from the CWFIS was uploaded into an interactive map, the speed of analyzing wildfire behaviour would be massively accelerated. With proper context (delivered in reactive visuals), even the general public could engage and understand the data.
Stage One | Get The Data
Everyday, wildfire data was published by the Canadian Government (through FireMP3 or FIRMS) in the form of a CSV file. The TSR team decided to upload it into Deck GL, which worked right away.
Stage Two | Streamline The Backend
The CSV files contained all the right data - but unfortunately came in a file size of over 100MB.
“The page was clunky and slow, lacking the convenience we hoped to create.”
To streamline the data, TSR began tiling it. Tiling enabled TSR to present users with only the data relevant to their current view and at the appropriate resolution. This avoided unnecessary information outside their focus area.
Stage Three | Cut Down Price
With the data now secured and functionality improved, the next challenge to tackle became the price.
“Originally it was costing upwards of $500 a month just to upload the data.”
The TSR team came together again to explore a concept they'd seen someone implement: PM tiles. This tiling format consolidated the data into a single file, reducing the cost to mere penny's overnight. This eliminated the financial strain on Lens, allowing them to prioritize innovation versus revenue generation.
Stage Four | Make It Pretty
Every detail of the Lens interface went through multiple iterations to get it ‘just right.’ Multiple developers on the TSR team have designed Video Games - an experience they repeatedly drew from to craft the best design possible.
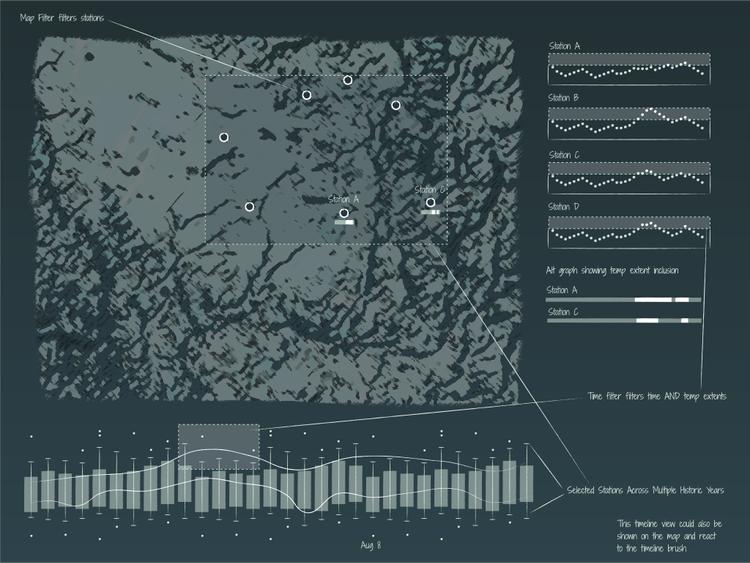
- The scrubber (seen below) was a critical component in delivering the historic data in a playback format.
- The shader (dots) seen below that indicate the intensity / location of the fire used GPU technology to deliver a seamless experience for users.
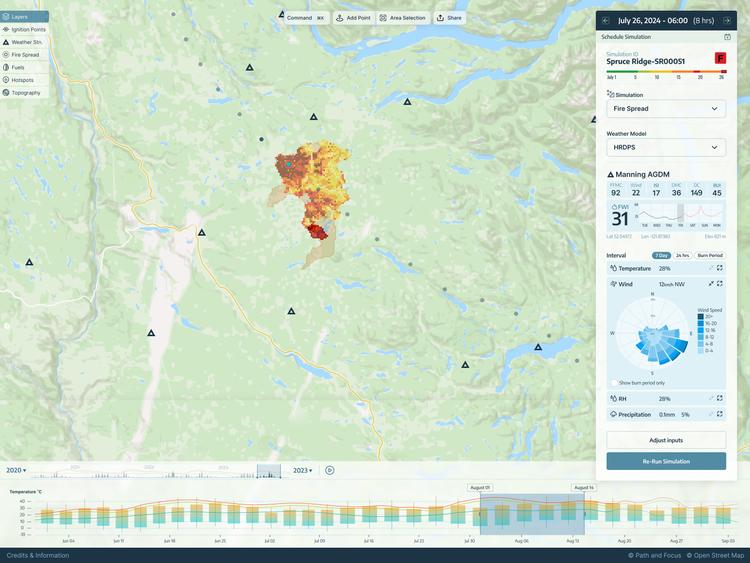
Stage Five | Continual Development
Since publication, Lens has continued to refine its interface, including the implementation of evacuation zones, fire corridors and perimeter estimates. In an effort to make the experience more accessible, a command bar has also been integrated, allowing more keyboard driven interaction.
With consistent communication and a strong sense of optimistic creativity, TSR was able to invent a solution that not only serves those who interact with wildfire data, but anyone wanting a blueprint for geospatial mapping.